
So I have been into web dev for about 3 years now and professionally for more than a year, This was the first time I had handled an issue that was related to db query optimization and I am no SQL guru, I can just about get the job done. No fancy queries, triggers, stored procedures, etc. I had to google the last one anyways..
Long story short.. our ORM (TypeORM) screwed us badly..
DISCLAIMER:
This is not to defame TypeORM or any ORM They are exceptional tools for what they are built for.. I have attached some reference links in the end which are open discussions where people are facing similar issues. Anyway, let's move on with the article.
The issue!
Our submissions table which has more than 700k records was performing horribly. The maximum time to just fetch the data from the table was more than 6 seconds.

The query was rather simple. All we had in there were 4 joins, a couple of where clauses (about 4), sorting (DESC on the created_at time field), limit, and skip.
Root Cause analysis..
A couple of points that contributed to the massive slowdown that we faced in our submissions table are as follows:-
- Indexing - Improper or no indexing done on the columns that were being used to join the tables.
- Unnecessary JOINS- There are some unnecessary joins in our query that could be removed to gain more perf.
- Empty String Bug - A bug in our code where we are comparing with an empty string (“”) for all the columns that were part of the where condition of the query if no user input was provided for those columns.
- The ORM - The ORM was running a super stupid query to get the data.
These are the pinpoints that I found while going through the code and our database schema and also while analyzing the query that was being run to get the data needed.
Analyzing and testing for every issue mentioned.
Cause 1: Indexing
After doing some googling and reading through people’s similar problems I found that ours was not that big an issue. People are struggling with millions of rows, ours was just a fraction of that so there must be something that we were doing wrong.
Many suggestions were there from the community who solved these problems earlier. I found that doing proper indexing can help a lot.
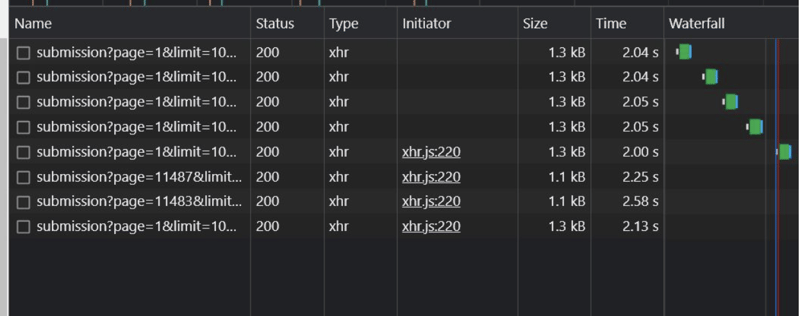
And so for testing, I took the submission from the beta db which had about more than 100k records.
Without any optimizations, it was taking 2.3 seconds to run the whole thing on average. (of course, this time does not only include the time to run the query on the DB, it includes the time to propagate the data over the network also)
After adding indexing to the columns I did find out that it shaved off a couple of ms from the time but it wasn’t enough. It was still around the 2-second mark and more often than not more than that.
So that was kind of a bummer! Anyways moving on to the next cause.
Cause 2: Empty String bug
So we got from 2.3 seconds to about 2 seconds which is not a lot from just indexing. But then I found a small bug in our code where suppose there are four input fields for the user to type and filter results based on four different columns. If the user hasn’t typed anything on any of the inputs which is mostly at the time when the page first loads and the API call goes through to just get the latest data without any filtering and just joining and sorting.
So at that moment we passed “” string for all the columns in our db and that seemed harmless but actually what was going on was for all four columns the db was doing a lookup with you guessed it “” strings. And so that was a lot of lookup for literally nothing.
So when I changed that to empty like empty/null (equivalent to removing the where clause from the query) the query time went from 2.3 to 1.3 seconds.
And If you are wondering what was the time it was taking to do filtering with an actual input provided by the user. It was around 500ms (this is kind of acceptable).
Conclusion - “” strings don’t play well even if you have your db indexed with all the searchable columns.
Okay, we are moving in the right direction. We shaved off 1 complete second but then still we had to make it under 200/150ms, So still a long way to go.
Cause 3: Unnecessary joins
While querying submissions we are doing joins with contest and course tables which are not required. So we just removed it Idk when all that got added in the code but that goes to show that the reviewers weren’t paying much attention (I was one of them) anyhow..
Cause 4: The ORM
This was the issue that was causing the most.. Well.. ISSUE!!.
So there is something called the active record pattern which TypeORM provides us devs to generate SQL queries using JSON-like objects and an example would be.
model.find({
      select: { userName : true, firstName : true },
      where: { userName : “SomeUsername” },
      relations: { user : true, contest: true, problem: true },
      order: { created_at : “ASC/DESC” ,
      skip: 0,
      take: 10,
})
So this makes development fast and easy and feels very intuitive for a developer who is not good with writing raw SQL queries as this is the most abstract version of that, you are literally making JSON objects to generate SQL queries.
This approach seems fine and most of the time it works but in our case, it was doing something royally stupid, I won’t type what it was doing so you can see the query for yourself.
In short it was running two queries which first of all not needed at all for this case it could be easily done with a simple and single query which I wrote later on and tested.
Not only was it running two separate queries (the reasons for which are unclear as this is a known issue and sometimes happens when using the typeorm’s active record pattern), it was also joining the four tables twice once each both the queries and then also sorting twice once each in both. (Which makes literally no sense)
And this is where the performance was taking the most hit. Take a look at the queries below yourself.
SELECT DISTINCT
`distinctAlias`.`Submission_id` AS `ids_Submission_id`, `distinctAlias`.`Submission_created_at`
FROM (SELECT `Submission`.`id` AS `Submission_id`, ... more selects
FROM `submission` `Submission`
LEFT JOIN `problem` `SubmissionSubmission_problem`
ON `SubmissionSubmission_problem`.`id`=`Submission`.`problemId`  LEFT JOIN
`user` `SubmissionSubmission_user`
ON `Submission_Submission_user`.`id`=`Submission`.`userId`) `distinctAlias`
ORDER BY `distinctAlias`.`Submission_created_at` DESC, `Submission_id`
ASC LIMIT 10
SELECT `Submission`.`id`
AS `Submission_id`, `Submission`.`language`
AS `Submission_language`, `Submission`.`verdictCode`
AS `Submission_verdictCode`, `Submission`.`tokens`
... shit ton of selects
FROM `submission` `Submission`
LEFT JOIN `problem` `SubmissionSubmission_problem`
ON `SubmissionSubmission_problem`.`id`=`Submission`.`problemId`  LEFT JOIN `user` `SubmissionSubmission_user`
ON `Submission_Submission_user`.`id`=`Submission`.`userId` WHERE `Submission`.`id`
IN (?, ?, ?, ?, ?, ?, ?, ?, ?, ?)
ORDER BY `Submission`.`created_at`
DESC
So these two queries were the main cause of the problem, well one of the main causes.
So I wrote a simple raw SQL query to do the exact same thing that it tried to do with 2 separate queries the query is mentioned below:-
SELECT
  Submission.id,
  Submission.language,
  Submission.verdictCode,
...
FROM
  submission AS Submission
  LEFT JOIN problem ...
  LEFT JOIN user ...
ORDER BY
  Submission.created_at DESC
LIMIT 10
And when we run this query it runs in just 100ms!!!
So we moved from 1.3 seconds to 100ms now, Overall from 2.3 seconds to 100ms
Which is a gain in performance by over 23x.
After that, I went to sleep. Still need to do a bit more testing and try to figure out edge cases if any and come up with the most optimal way to write the query for this. Currently, I am thinking of either using the repository pattern or the query builder pattern provided by TypeORM.
The Next Day:
Here we go again..
Full-Text indexing
Full-Text indexing can add another level of efficiency to search for words and phrases from these indexed columns, we can also give it a try. (This was a really good point added by my coworker Jay and it further improved performance).
Some more important points that were found.
When optimizing a LIKE query on a column with a unique index in MySQL, there are a few strategies you can employ to improve performance. Here are some suggestions:
-
Index Optimization:
- Use a Full-Text Index: Consider using a Full-Text Index instead of a regular unique index if your
LIKEqueries involve searching for words or phrases within the column. Full-text indexing is specifically designed for text-based searching and can provide faster and more accurate results. -
Use a Collation: Ensure that the column's collation is case-insensitive and accent-insensitive. This can be achieved by using a collation like
utf8_general_ciorutf8mb4_general_ci. It allows the index to be utilized more effectively, as the search becomes case and accent insensitive.
- Use a Full-Text Index: Consider using a Full-Text Index instead of a regular unique index if your
-
Query Optimization:
-
Prefix Searching: If your
LIKEquery uses a wildcard at the end (e.g.,column LIKE 'prefix%'), the index can still be used efficiently. However, if the wildcard is at the beginning (e.g.,column LIKE '%suffix'), the index won't be utilized. In such cases, consider using alternative techniques like a Full-Text Search or storing reversed values of the column for efficient suffix searching. -
Minimize Wildcards: Wildcards at the beginning of a pattern (
'%suffix') can make the query significantly slower. If possible, try to structure your queries so that the wildcard is only at the end of the pattern ('prefix%'). -
Parameter Binding: If you're executing the
LIKEquery from within an application, use parameter binding or prepared statements instead of concatenating the query string directly. This helps prevent SQL injection and allows the database to cache the execution plan more effectively.
-
Prefix Searching: If your
-
Caching and Query Results:
-
Cache Query Results: If the
LIKEquery results are relatively static or don't need to be real-time, consider implementing caching mechanisms like memcached or Redis. Caching can significantly improve the response time by serving the results directly from memory. -
Materialized Views: If the
LIKEquery is frequently executed and the column's data is relatively static, consider creating a materialized view that precomputes and stores the results of theLIKEquery. This approach can be beneficial if the performance gains from querying the materialized view outweigh the additional storage and maintenance requirements.
-
Cache Query Results: If the
It's important to note that the effectiveness of these optimization strategies may vary depending on your specific use case.
Suggested points of improvement after all the testing.
- Fix the passing of empty strings into where/filtering conditions.
- Move to using query builders instead of the active record pattern for read operations where performance is key.
- Adding Indexes to columns which are used for searching and filtering. Also, add FULL-TEXT Indexing on columns that are not unique and are used for searching.
- Remove/Avoid unnecessary joins. If possible restructure the schema to duplicate data if necessary.
- When searching with LIKE Operator use the 'prefix%' pattern instead of the default one which we are using which is ‘%suff+pref%’. Using the prefix pattern helps the db to use the indexes and give better results.
And with all that, we were successfully able to bring the query time from 7 seconds to under <=150 ms, Felt good after doing this as this was the first time I was stepping into performance and optimization and looking for ways to squeeze out more from what we already have.
Special thanks to Mitesh Sir for pointing out potential causes and steering me in the right direction during this investigation and also for restarting the beta server over and over 😂 because the db would just become so slow after running the test so many times because of memory constraints.
Follow me on X if you wanna talk more about stuff related to all this, https://twitter.com/RishiNavneet
References
- https://github.com/typeorm/typeorm/issues/3857#issuecomment-714758799
- https://github.com/typeorm/typeorm/issues/3857
- https://stackoverflow.com/questions/714950/mysql-performance-optimization-order-by-datetime-field
- https://stackoverflow.com/questions/22411979/mysql-select-millions-of-rows
- https://dba.stackexchange.com/questions/20335/can-mysql-reasonably-perform-queries-on-billions-of-rows
- https://stackoverflow.com/questions/38346613/mysql-and-a-table-with-100-millions-of-rows
- https://github.com/typeorm/typeorm/issues/3191
PS - These improvements were done long back and I was just too lazy to post it 😬.


